Starhill Global REIT has delivered a steadfast performance since
its public listing in 2005 through proactive lease management,
sourcing accretive acquisitions and creative asset enhancements.
Throughout, we maintained a sound financial standing, a strategy
that enabled us to survive in the face of challenging economic
cycles and deliver sustainable returns for our Unitholders.
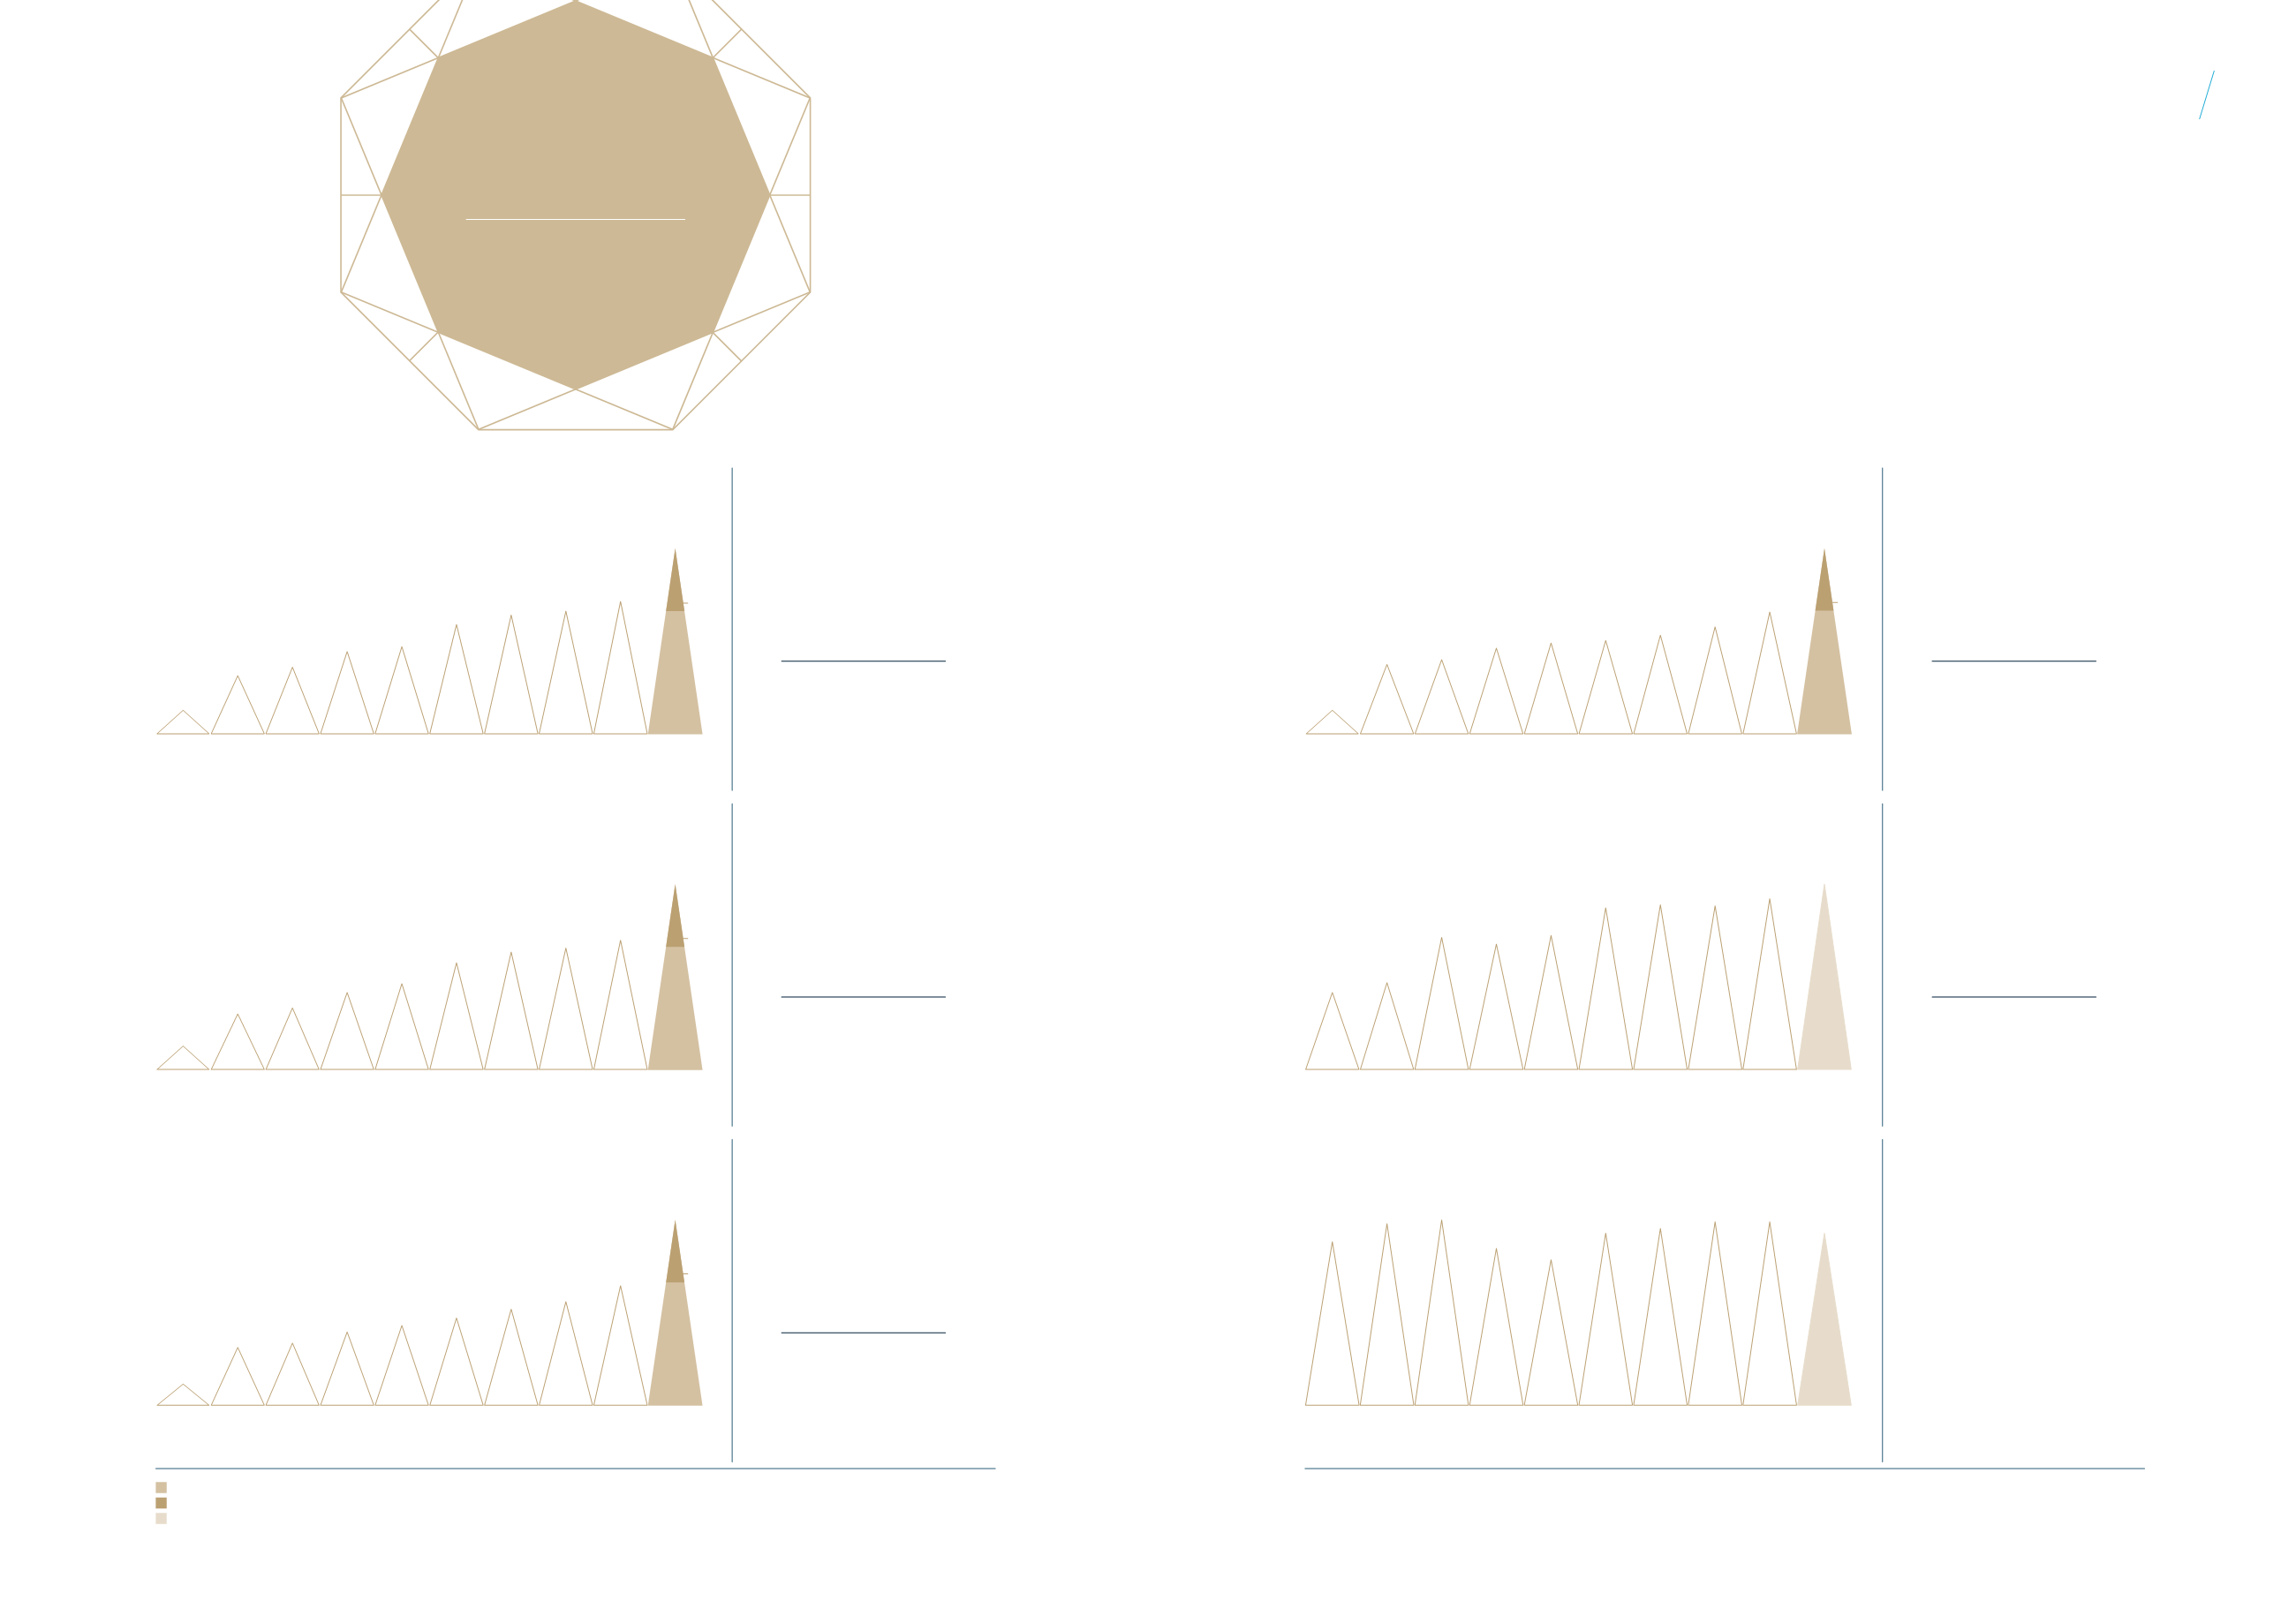
DPU
(3)
(cents)
Total Assets
(S$ million)
Occupancy Rate
(%)
FY
05
(1)
FY
06
FY
07
FY
08
FY
09
FY
10
FY
11
FY
12
FY
13
FY
14/15
0.79 2.90 3.10 3.58 3.80 3.90 4.12 4.39 5.00
5.05
Dec
05
Dec
06
Dec
07
Dec
08
Dec
09
Dec
10
Dec
11
Dec
12
Dec
13
Jun
15
1,353.5 1,525.8 2,277.6 2,163.4 2,312.3 2,786.6 2,839.1 2,820.2 2,943.2 3,193.4
Dec
05
Dec
06
Dec
07
Dec
08
Dec
09
Dec
10
Dec
11
Dec
12
Dec
13
Jun
15
97.3 99.2 99.6 96.6 95.4 98.2 98.7 99.4 99.4 98.2
7.60
¢
FY 2014/15
CAGR
(2) (3)
+7.2%
S$
3,193.4
m
JUNE 2015
CAGR +9.5%
98.2
%
JUNE 2015
Notes:
(1)
For the period from IPO in September 2005 to December 2005.
(2)
Excluded FY 2005 and the additional six months from January 2015 to June 2015 for FY 2014/15.
(3)
DPU from FY 2005 to 2Q FY 2009 have been restated to include the 963,724,106 rights units issued in August 2009.
Celebrating
10 Years
of Brilliance
Key Figures
for 10 Years
7.60
Gross Revenue
(S$ million)
Net Property Income
(S$ million)
Income Available for Distribution
(S$ million)
FY
05
(1)
FY
06
FY
07
FY
08
FY
09
FY
10
FY
11
FY
12
FY
13
FY
14/15
19.4 69.3 76.8 95.9 106.9 130.5 143.6 148.4 157.9
157.4
FY
05
(1)
FY
06
FY
07
FY
08
FY
09
FY
10
FY
11
FY
12
FY
13
FY
14/15
14.9 54.9 59.0 69.4 75.5 82.5 90.8 96.2 110.9
113.7
S$
294.8
m
FY 2014/15
CAGR
(2)
+10.2%
S$
237.6
m
FY 2014/15
CAGR
(2)
+10.8%
S$
171.6
m
FY 2014/15
CAGR
(2)
+9.5%
January 2014 – December 2014
January 2015 – June 2015
As at 30 June 2015
99.7
2.55
80.2
57.9
237.6
294.8
171.6
FY
05
(1)
FY
06
FY
07
FY
08
FY
09
FY
10
FY
11
FY
12
FY
13
FY
14/15
25.2 89.9 103.0 127.0 134.6 165.7 180.1 186.0 200.6
195.1
13
12


