


 13 / 152

Notes:
(1)
Numbers for FY 2014/15 (18 months ended 30 June 2015) have been annualised for the purpose of calculating CAGR.
(2)
Includes additional six months from January 2015 to June 2015 for FY 2014/15.
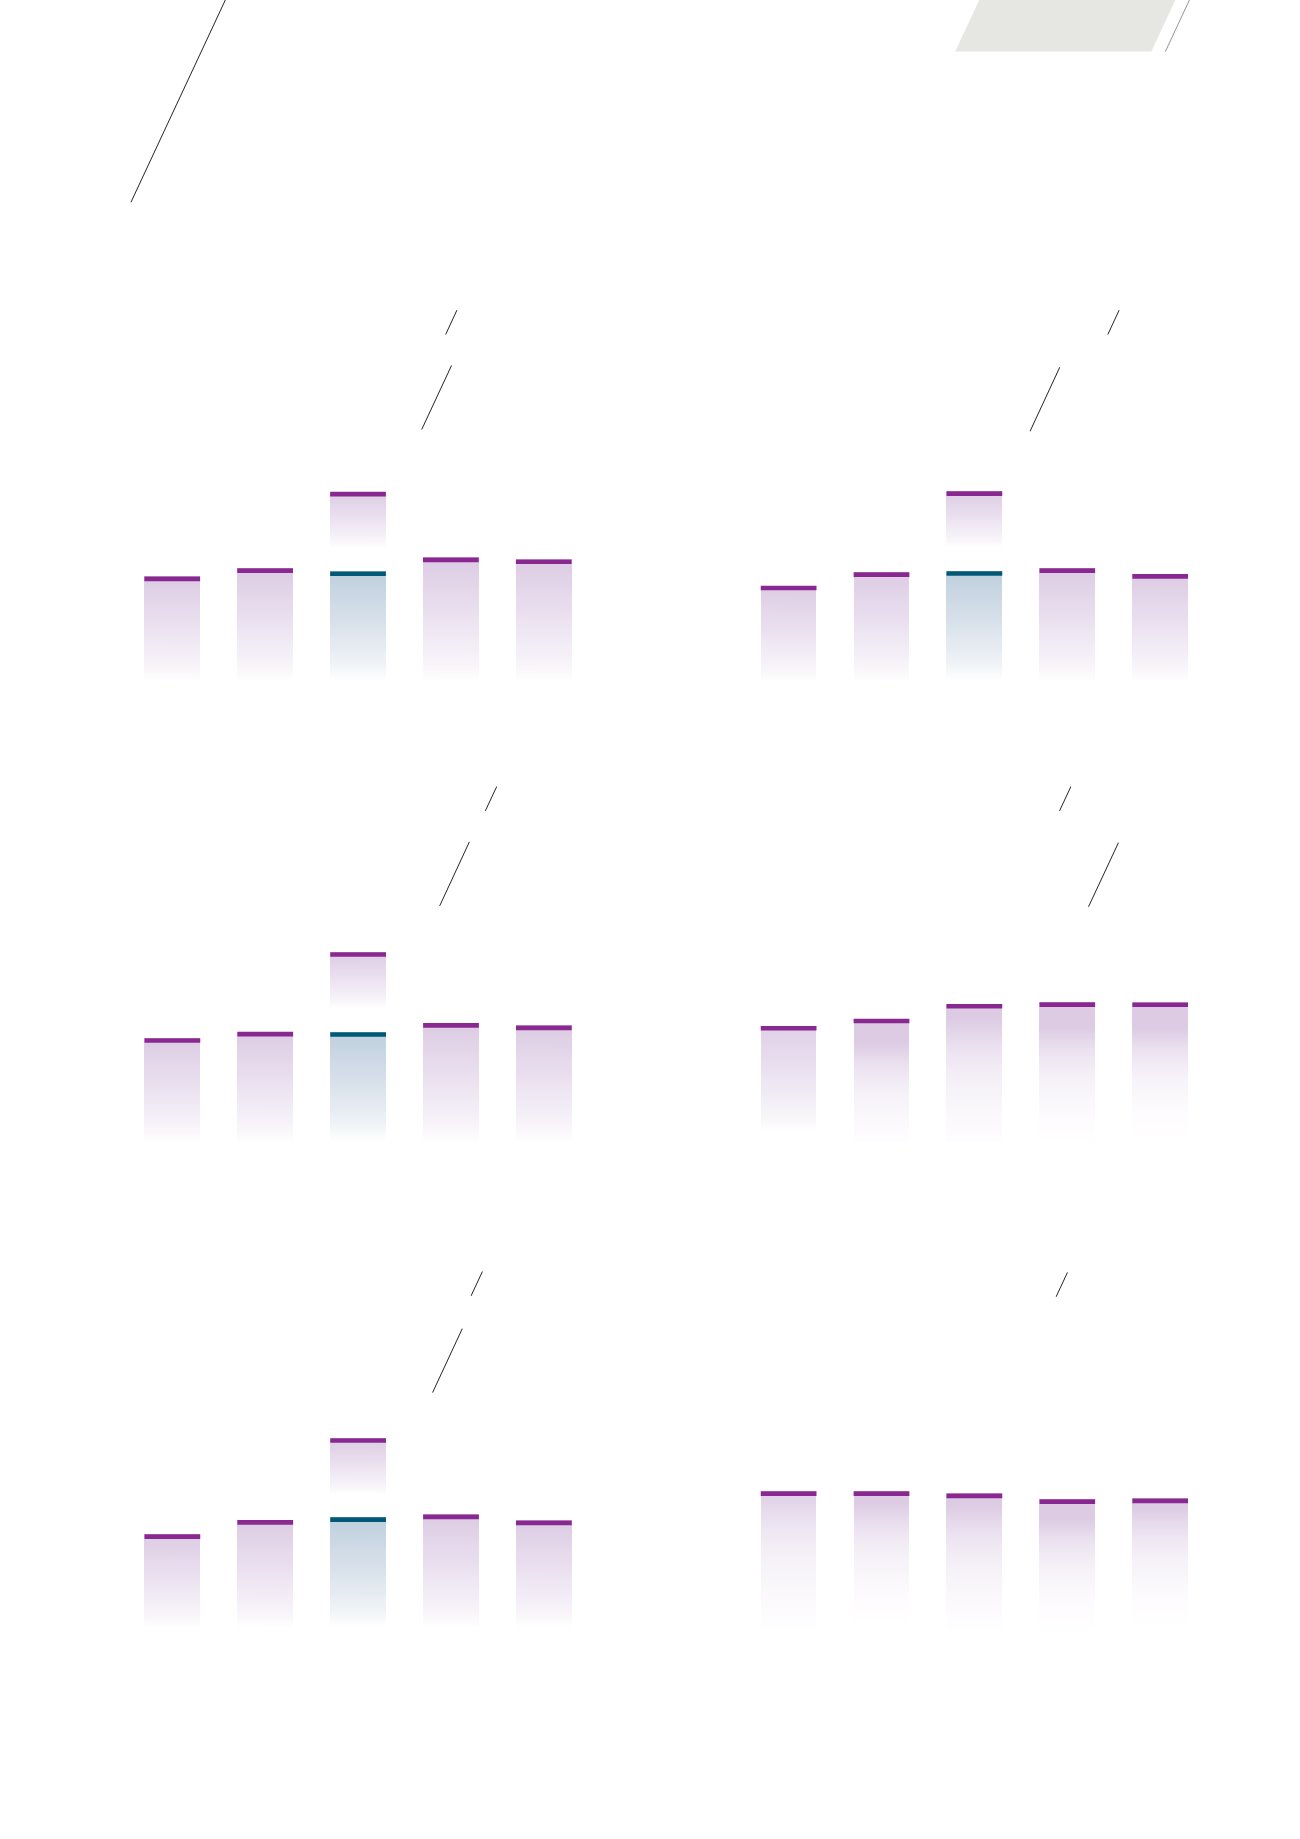
KEY FIGURES
FOR 5YEARS
GROSS REVENUE
FY 2016/17
CAGR
S$
216.4
M
+3.9
%
(1)
186.0
200.6
195.1
294.8
(2)
219.7
216.4
FY 12
FY 13
FY 14/15
FY 15/16
FY 16/17
(S$ MILLION)
96.2
110.9
113.7
171.6
(2)
116.5
110.4
FY 12
FY 13
FY 14/15
FY 15/16
FY 16/17
CAGR
S$
110.4
M
+3.5
%
(1)
INCOME AVAILABLE
FORDISTRIBUTION
FY 2016/17
(S$ MILLION)
2,820.2 2,943.2
3,193.4 3,222.2
3,219.4
DEC 12
DEC 13
JUN 15
JUN 16
JUN 17
CAGR
S$
3,219.4
M
+3.0
%
TOTAL ASSETS
JUN 2017
(S$ MILLION)
148.4
157.9
237.6
(2)
157.4
170.3
166.9
FY 12
FY 13
FY 14/15
FY 15/16
FY 16/17
CAGR
S$
166.9
M
+3.0
%
(1)
NET PROPERTY INCOME
FY 2016/17
(S$ MILLION)
CAGR
4.92
¢
+2.9
%
(1)
DISTRIBUTION PER UNIT
FY 2016/17
4.39
5.00
5.05
7.60
(2)
5.18
4.92
FY 12
FY 13
FY 14/15
FY 15/16
FY 16/17
(CENTS)
99.4
99.4
98.2
95.1
95.5
DEC 12
DEC 13
JUN 15
JUN 16
JUN 17
95.5
%
OCCUPANCY RATE
JUN 2017
(%)
OVERVIEW
11