


 31 / 152

TOP 10 TENANTS
TENANT NAME
PROPERTY
% OF PORTFOLIO
GROSS RENT
(1) (2)
Toshin Development
Singapore Pte. Ltd.
Ngee Ann City Property, Singapore
20.8%
YTL Group
(3)
Ngee Ann City Property &
Wisma Atria Property, Singapore
Starhill Gallery & Lot 10 Property, Malaysia
14.0%
Myer Pty Ltd
Myer Centre Adelaide, Australia
6.8%
David Jones Limited David Jones Building, Australia
4.5%
Cortina Watch Pte Ltd Ngee Ann City Property &
Wisma Atria Property, Singapore
2.4%
Cotton On Group
Wisma Atria Property, Singapore,
Myer Centre Adelaide, Australia
2.2%
BreadTalk Group
Wisma Atria Property, Singapore
1.7%
Coach Singapore
Pte. Ltd.
Wisma Atria Property, Singapore
1.5%
Charles & Keith Group Wisma Atria Property, Singapore
1.3%
LVMH Group
Ngee Ann City Property &
Wisma Atria Property, Singapore
1.2%
Notes:
(1)
As at 30 June 2017.
(2)
The total portfolio gross rent
is based on the gross rent of
all the properties.
(3)
Consists of Katagreen
Development Sdn Bhd,
YTL Singapore Pte. Ltd.,
YTL Starhill Global REIT
Management Limited and
YTL Starhill Global Property
Management Pte. Ltd.
Notes:
(1)
Lease expiry schedule based
on committed leases as at
30 June 2017.
(2)
Includes the master tenant
leases in Malaysia that expire
in 2019.
(3)
Includes the Toshin master
lease that expires in 2025
and the long-term leases
in Australia and China.
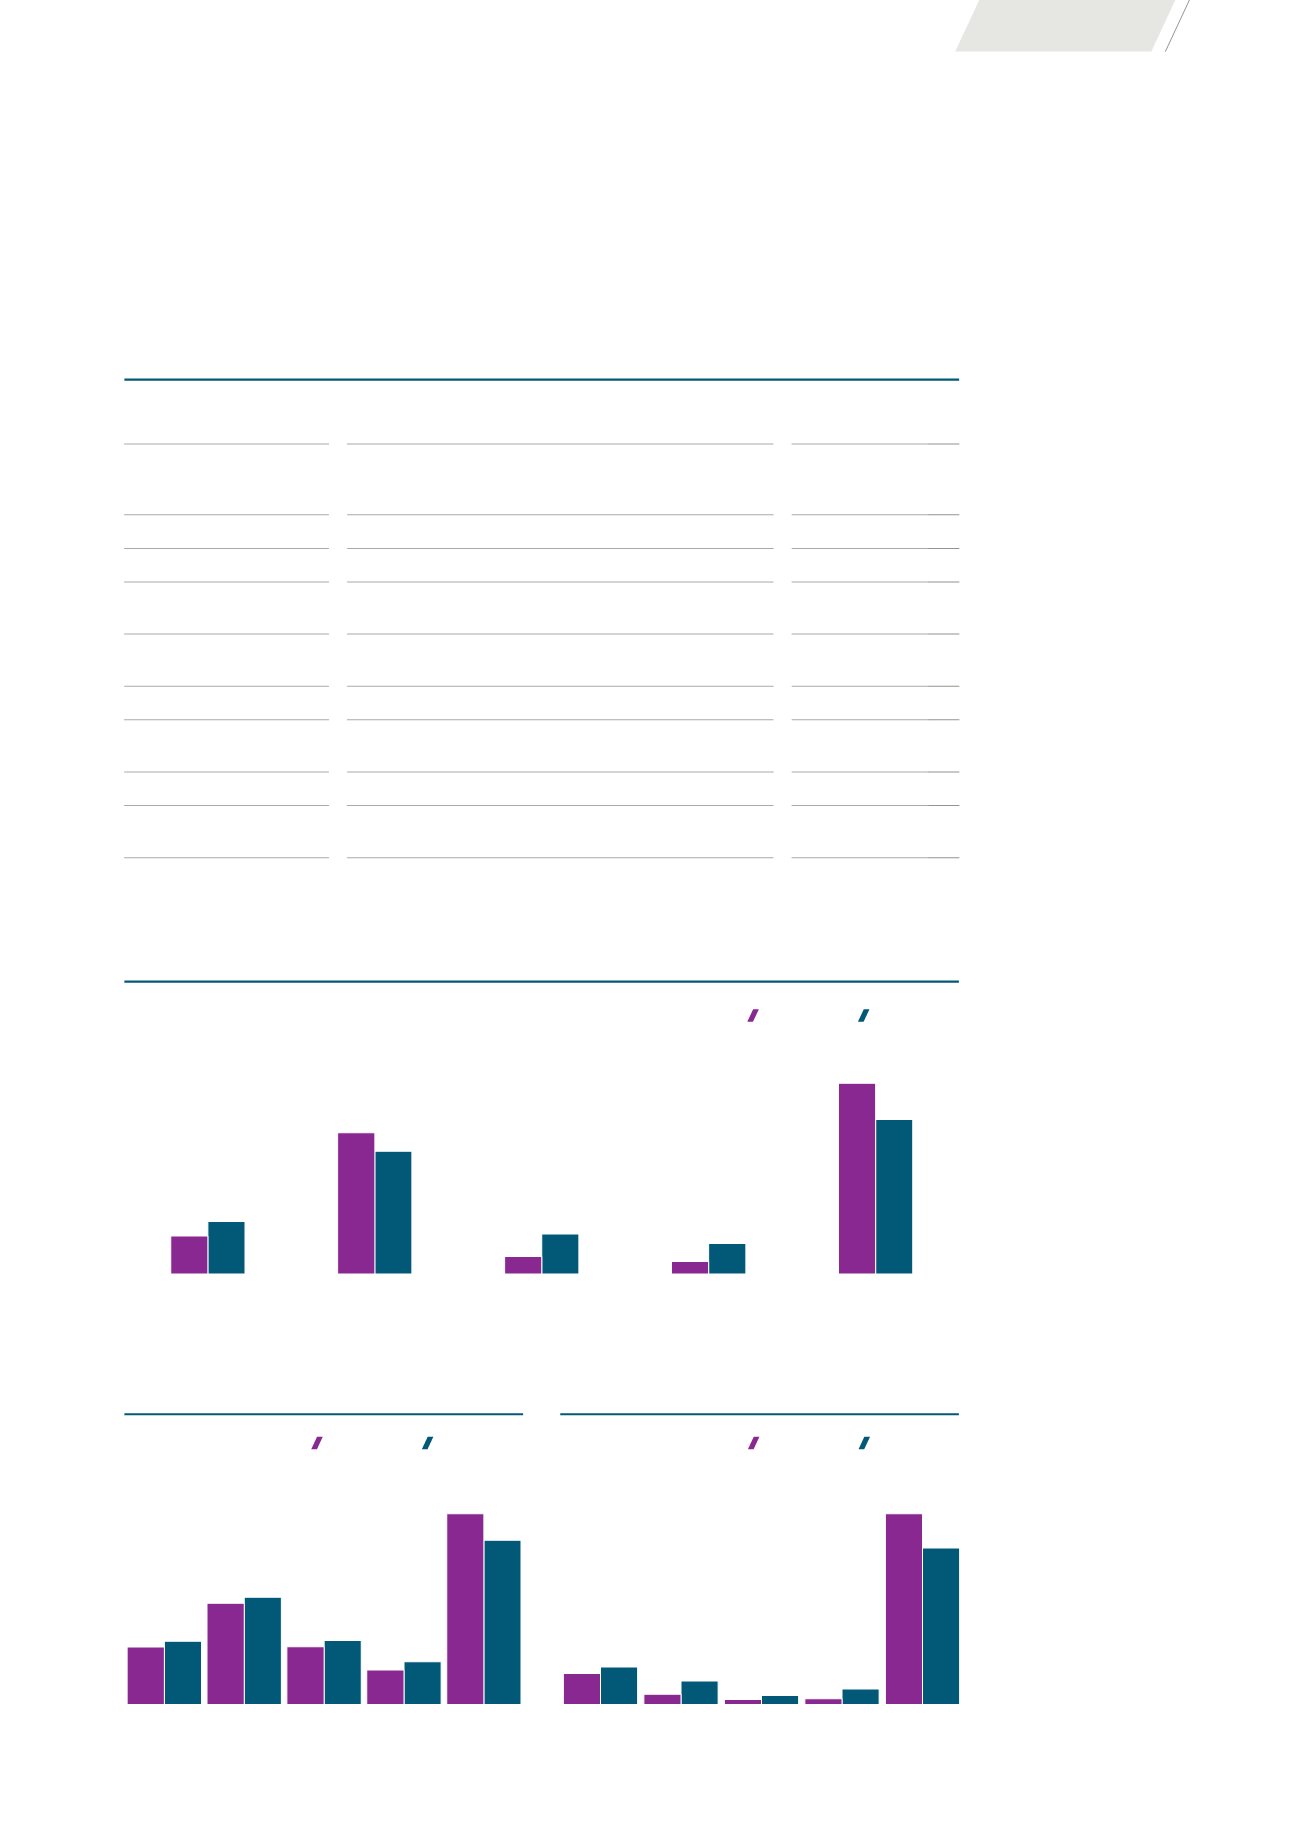
PORTFOLIO LEASE EXPIRY
(1)
AS AT 30 JUN 2017 (%)
9.5
13.1
4.4
10.0
3.1
7.6
FY 2017/18
FY 2018/19
FY 2019/20
FY 2020/21
Beyond FY 2020/21
By NLA
By Gross Rent
AUSTRALIA PORTFOLIO LEASE EXPIRY
(1)
AS AT 30 JUN 2017 (%)
12.8
15.5
4.3
9.7
1.6
3.7
2.4
6.4
78.9
64.7
FY 2017/18 FY 2018/19 FY 2019/20 FY 2020/21
Beyond
FY 2020/21
By NLA
By Gross Rent
SINGAPORE PORTFOLIO LEASE EXPIRY
(1)
AS AT 30 JUN 2017 (%)
13.0
14.3
22.9
24.3
13.1
14.5
7.8
9.7
43.2
37.2
FY 2017/18 FY 2018/19 FY 2019/20 FY 2020/21
Beyond
FY 2020/21
By NLA
By Gross Rent
35.3
(2)
30.7
(2)
47.7
(3)
38.6
(3)
OPERATIONS REVIEW
29