


 33 / 152

GROSS REVENUE BY RETAIL AND OFFICE
FY 2016/17
PORTFOLIO VALUATION
(S$ MILLION)
Notes:
(1)
Translated as at 30 June 2017
at A$0.95:S$1.00 (30 June 2016:
A$1.00:S$1.00).
(2)
Translated as at 30 June 2017
at RM3.12:S$1.00 (30 June 2016:
RM2.99:S$1.00).
(3)
Translated as at 30 June 2017
at JPY81.37:S$1.00 (30 June 2016:
JPY76.14:S$1.00).
(4)
Translated as at 30 June 2017
at RMB4.93:S$1.00 (30 June 2016:
RMB4.92:S$1.00).
PORTFOLIO VALUATION
DESCRIPTION
30 JUN 2017
(S$ MILLION)
30 JUN 2016
(S$ MILLION)
CHANGE
(S$ MILLION)
CHANGE
(%)
Wisma Atria Property
997.0
996.0
1.0
0.1%
Ngee Ann City Property
1,150.0
1,145.0
5.0
0.4%
Australia Properties
(1)
540.1
505.5
34.6
6.8%
Malaysia Properties
(2)
357.5
378.4
(20.9)
(5.5%)
Japan Properties
(3)
59.6
67.0
(7.4)
(11.0%)
China Property
(4)
32.1
44.7
(12.6)
(28.2%)
3,136.3
3,136.6
(0.3)
(0.0%)
Wisma Atria Property
Ngee Ann City Property
China Property
Japan Properties
Australia Properties
Malaysia Properties
Total
Sep 05 Dec 05 Dec 06 Dec 07 Dec 08 Dec 09 Dec 10 Dec 11 Dec 12 Dec 13 Jun 15 Jun 16 Jun 17
S$1,833 million
uplift since IPO
1,303 1,327
1,498
2,209
2,103
2,654
2,710 2,713
2,854
3,116 3,137 3,136
1,982
13.1
%
86.9
%
RETAIL
OFFICE
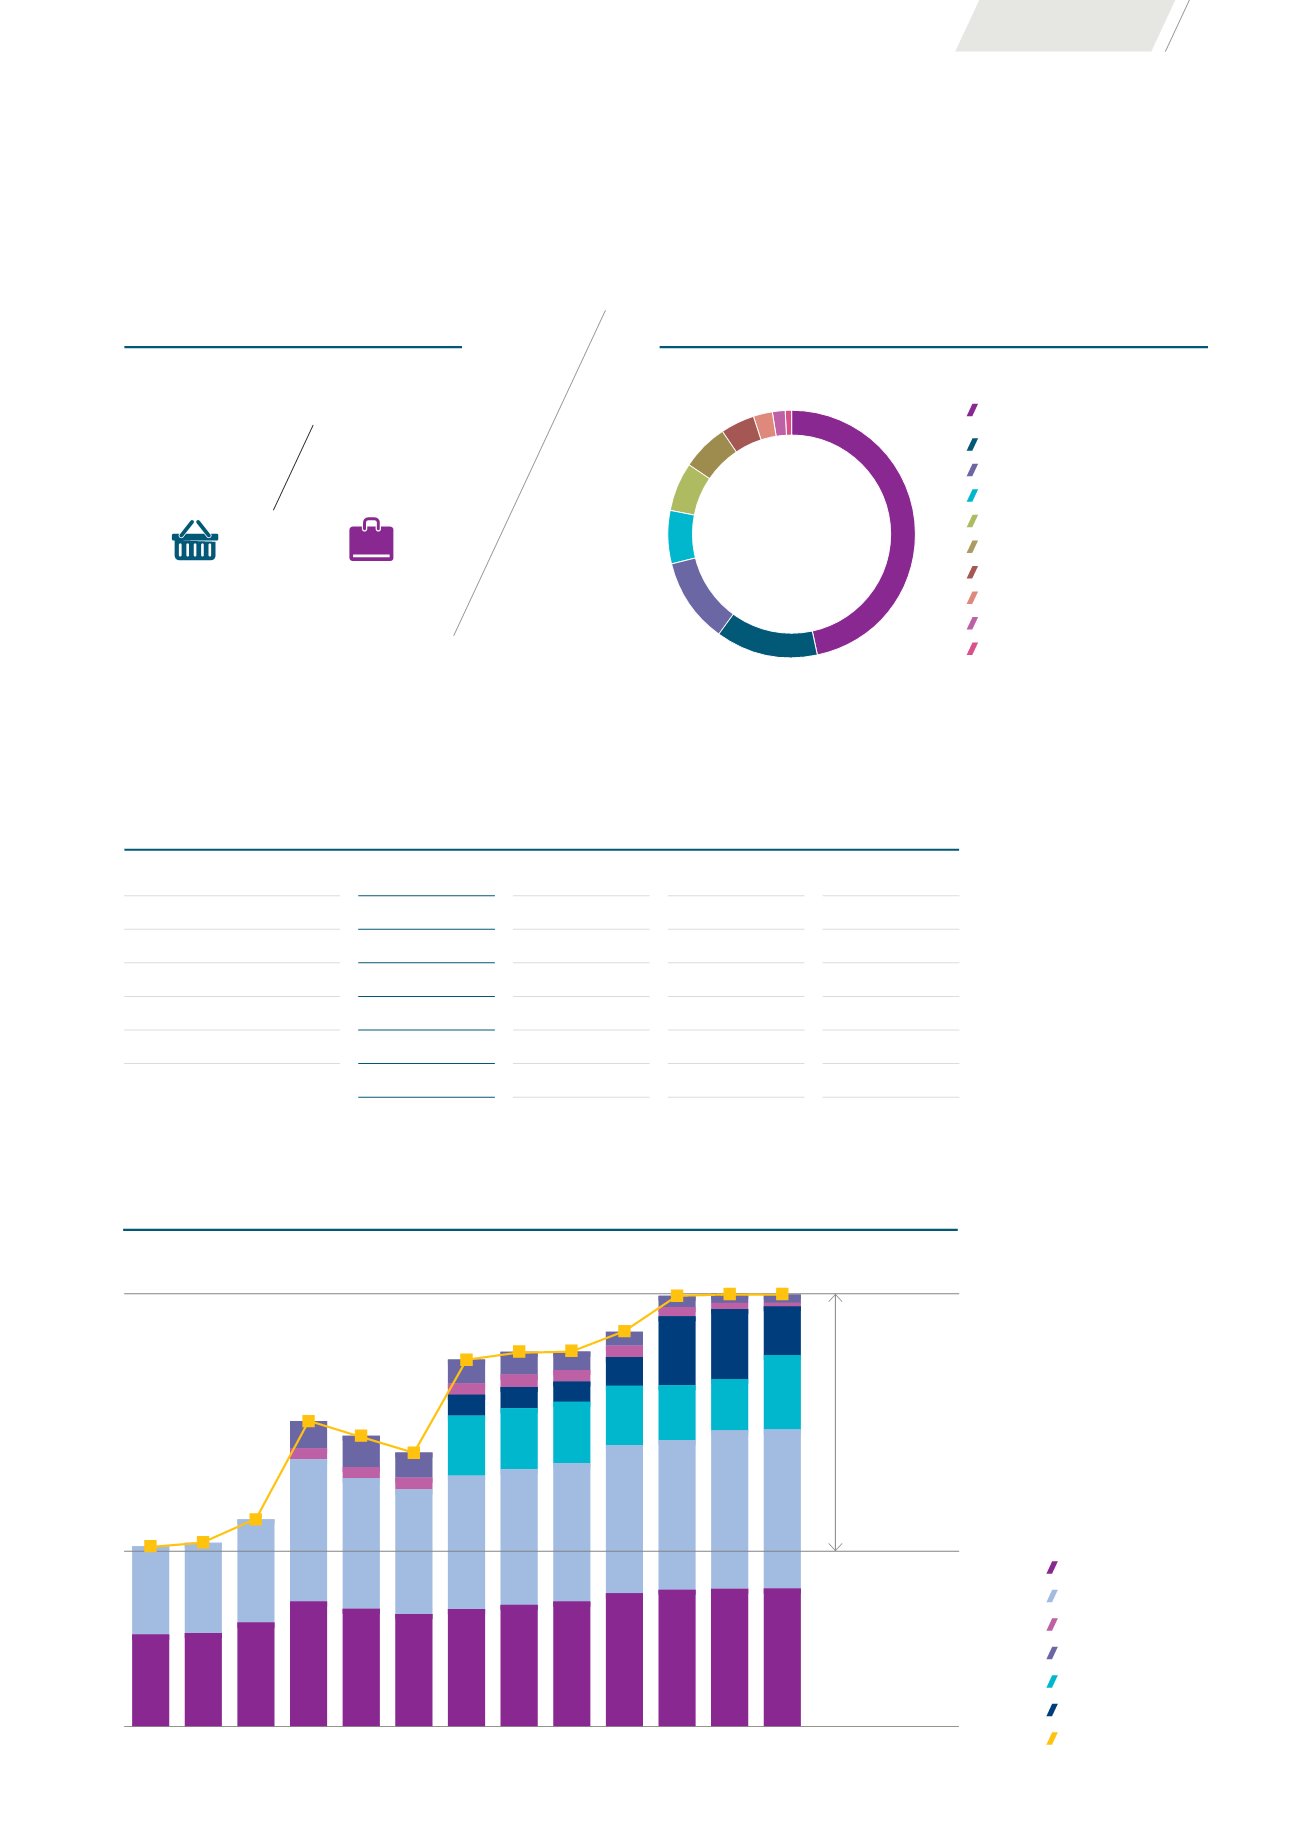
PORTFOLIO TRADE MIX
BY GROSS RENTAL CONTRIBUTION (AS AT 30 JUN 2017)
Master Tenancies &
Long-Term Leases
46.7%
Office
13.4%
Fashion
11.1%
F&B
6.9%
Jewellery & Watches
6.4%
Beauty & Wellness
6.3%
Shoes & Accessories
4.2%
General Trade
2.6%
Services
1.7%
Others
0.7%
OPERATIONS REVIEW
31