


 57 / 152

FY 2016/17
FY 2015/16
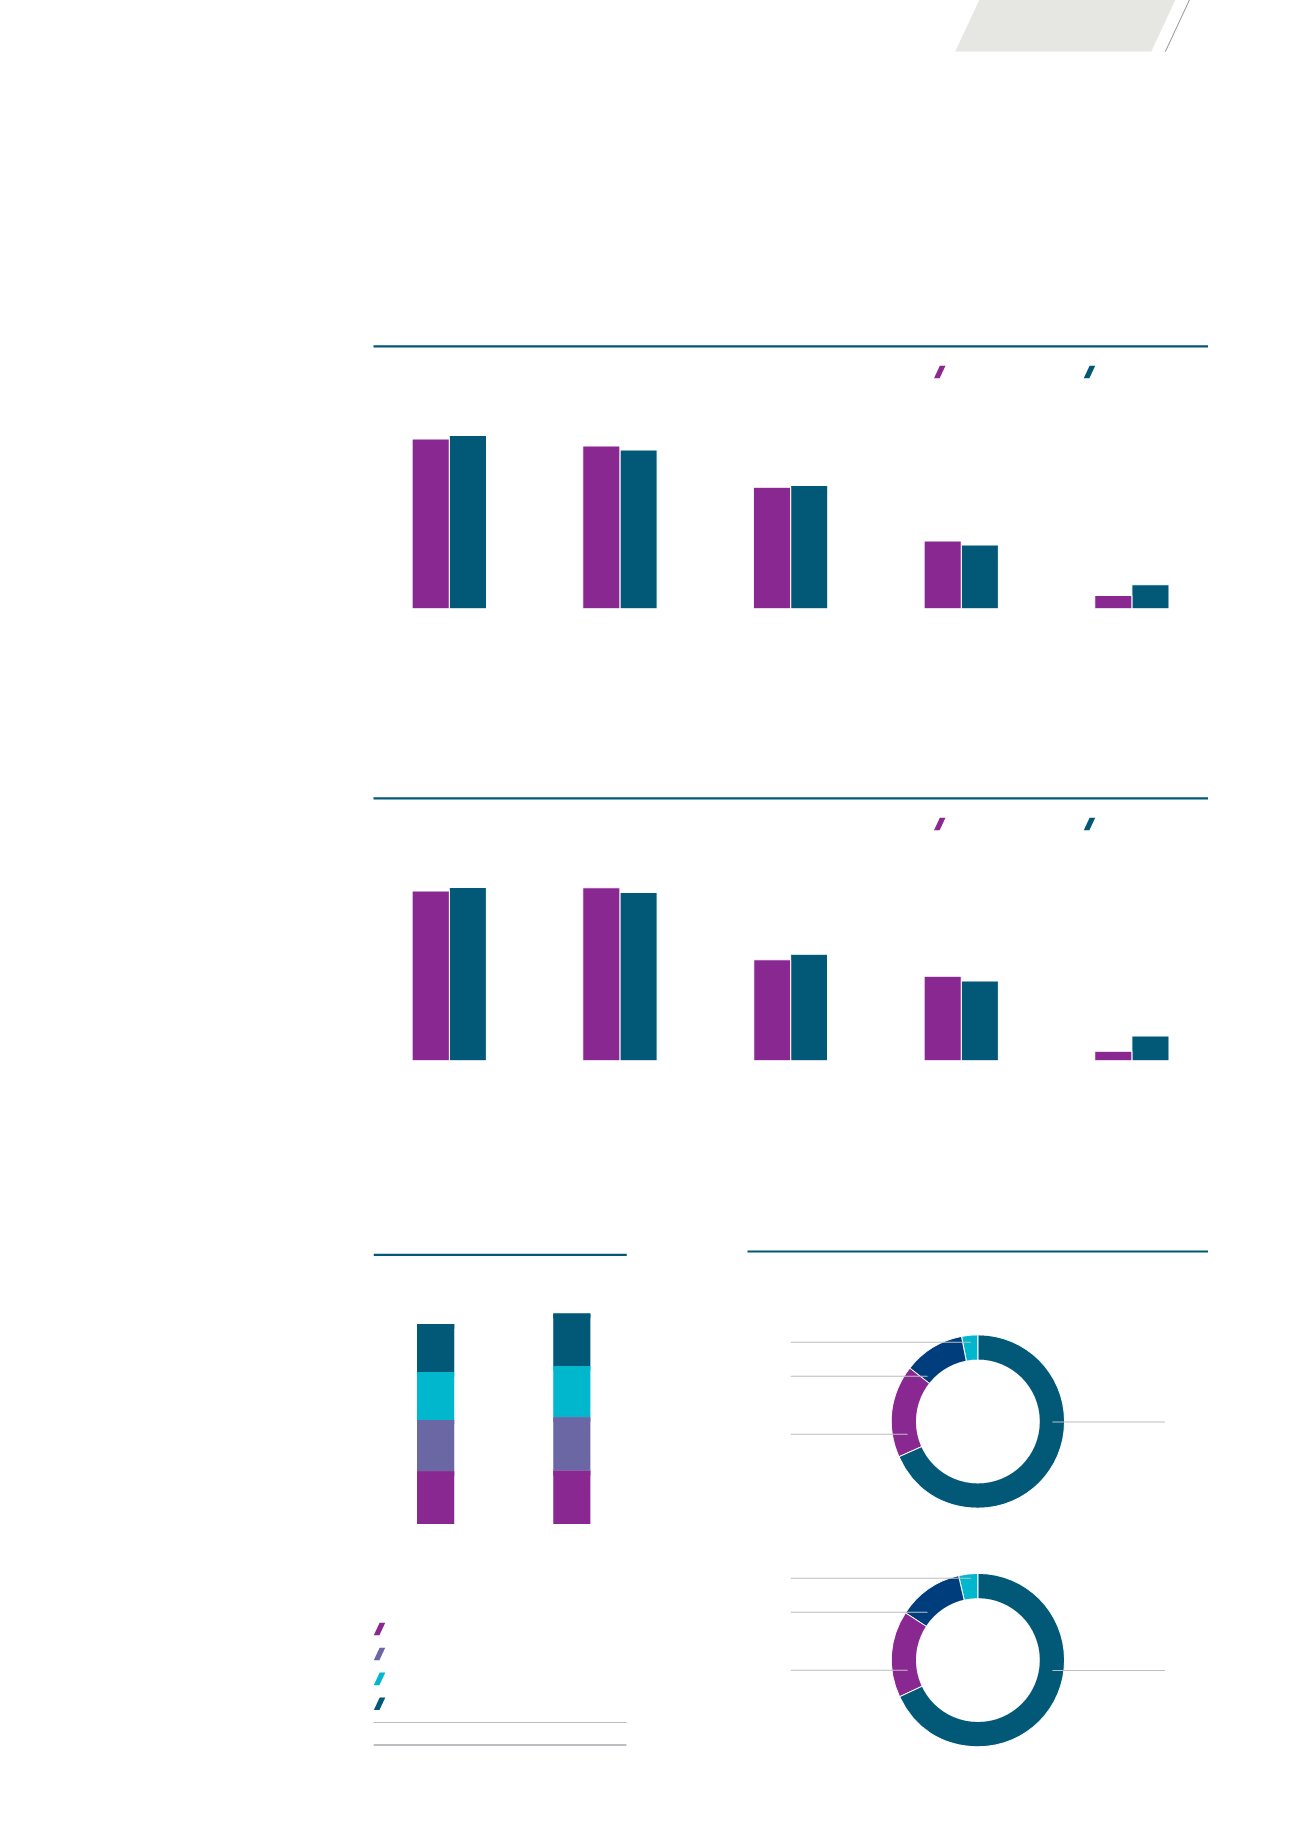
68.7
70.1
65.8
64.2
49.1
49.9
27.4
25.8
5.4
9.7
Wisma Atria
Property
Ngee Ann City
Property
Australia
Properties
Malaysia
Properties
Others
(1)
31.8%
31.9%
30.4%
29.2%
22.7%
22.7%
12.6%
11.7%
2.5%
4.5%
GROSS REVENUE
(S$ MILLION)
FY 2016/17
FY 2015/16
53.0
54.1
54.0
52.5
31.5
33.2
26.4
24.9
2.0
5.6
Wisma Atria
Property
Ngee Ann City
Property
Australia
Properties
Malaysia
Properties
Others
(1)
31.7%
31.8%
32.4%
30.8%
18.9%
19.5%
15.8%
14.6%
1.2%
3.3%
NET PROPERTY INCOME
(S$ MILLION)
ASSET VALUE BY COUNTRY
DISTRIBUTION PER UNIT
(CENTS)
4.92
(2)
5.18
(2)
FY 2016/17
FY 2015/16
FY 2016/17
FY 2015/16
1Q
1.30
1.31
2Q
1.26
1.32
3Q
1.18
1.26
4Q
1.18
1.29
4.92
5.18
Notes:
(1)
Others comprise of one
property in Chengdu, China
and three (FY 2015/16: four)
properties in Tokyo, Japan
as at 30 June 2017.
(2)
The computation of
DPU for FY 2016/17 and
FY 2015/16 was based on
number of units entitled to
distributions comprising
2,181,204,435 units in issue.
AS AT 30 JUN 2016
68.3%
Singapore
16.1%
Australia
12.1%
Malaysia
3.5%
Others
(1)
68.5%
Singapore
17.2%
Australia
11.4%
Malaysia
2.9%
Others
(1)
AS AT 30 JUN 2017
PERFORMANCE
55