


 59 / 152

interest rate caps. The weighted
average interest rate was
approximately 3.16% per annum as
at 30 June 2017. The interest service
coverage ratio was a healthy
4.2 times for the year ended 30
June 2017. The Manager intends
to continue to secure diversified
funding sources from both financial
institutions and capital markets
when opportunities arise, while
keeping Starhill Global REIT’s
ongoing cost of debt competitive.
FOREIGN EXCHANGE RISK
MANAGEMENT
As at 30 June 2017, Starhill Global
REIT is exposed to foreign exchange
risk arising from its investments
in Australia, Malaysia, China and
Japan. The income generated
from these investments and net
assets are denominated in foreign
currencies. In managing its currency
risks associated with its foreign
investments, Starhill Global REIT has
adopted the following income and
capital hedging strategies.
Income hedging
Starhill Global REIT’s core portfolio
is largely based in Singapore, which
contributed approximately 62% of its
revenue for the year ended 30 June
2017. Starhill Global REIT actively
monitors the exchange rates and
assesses hedging on a case-by-case
basis. The impact of the volatility
in the foreign currencies mainly
Australian dollar and Malaysian
Ringgit on its distributions has been
partially mitigated by having foreign
currency denominated borrowing
as a natural hedge, and short-term
foreign currency forward contracts.
Capital hedging
In managing the currency risks
associated with the capital values of
Starhill Global REIT’s overseas assets,
borrowings are denominated in the
same currency as the underlying
assets to the extent feasible, to
provide a natural currency hedge. As
the investments in overseas assets
are generally long term in nature, the
remaining net positions of the foreign
exchange risk on such investments
are not hedged.
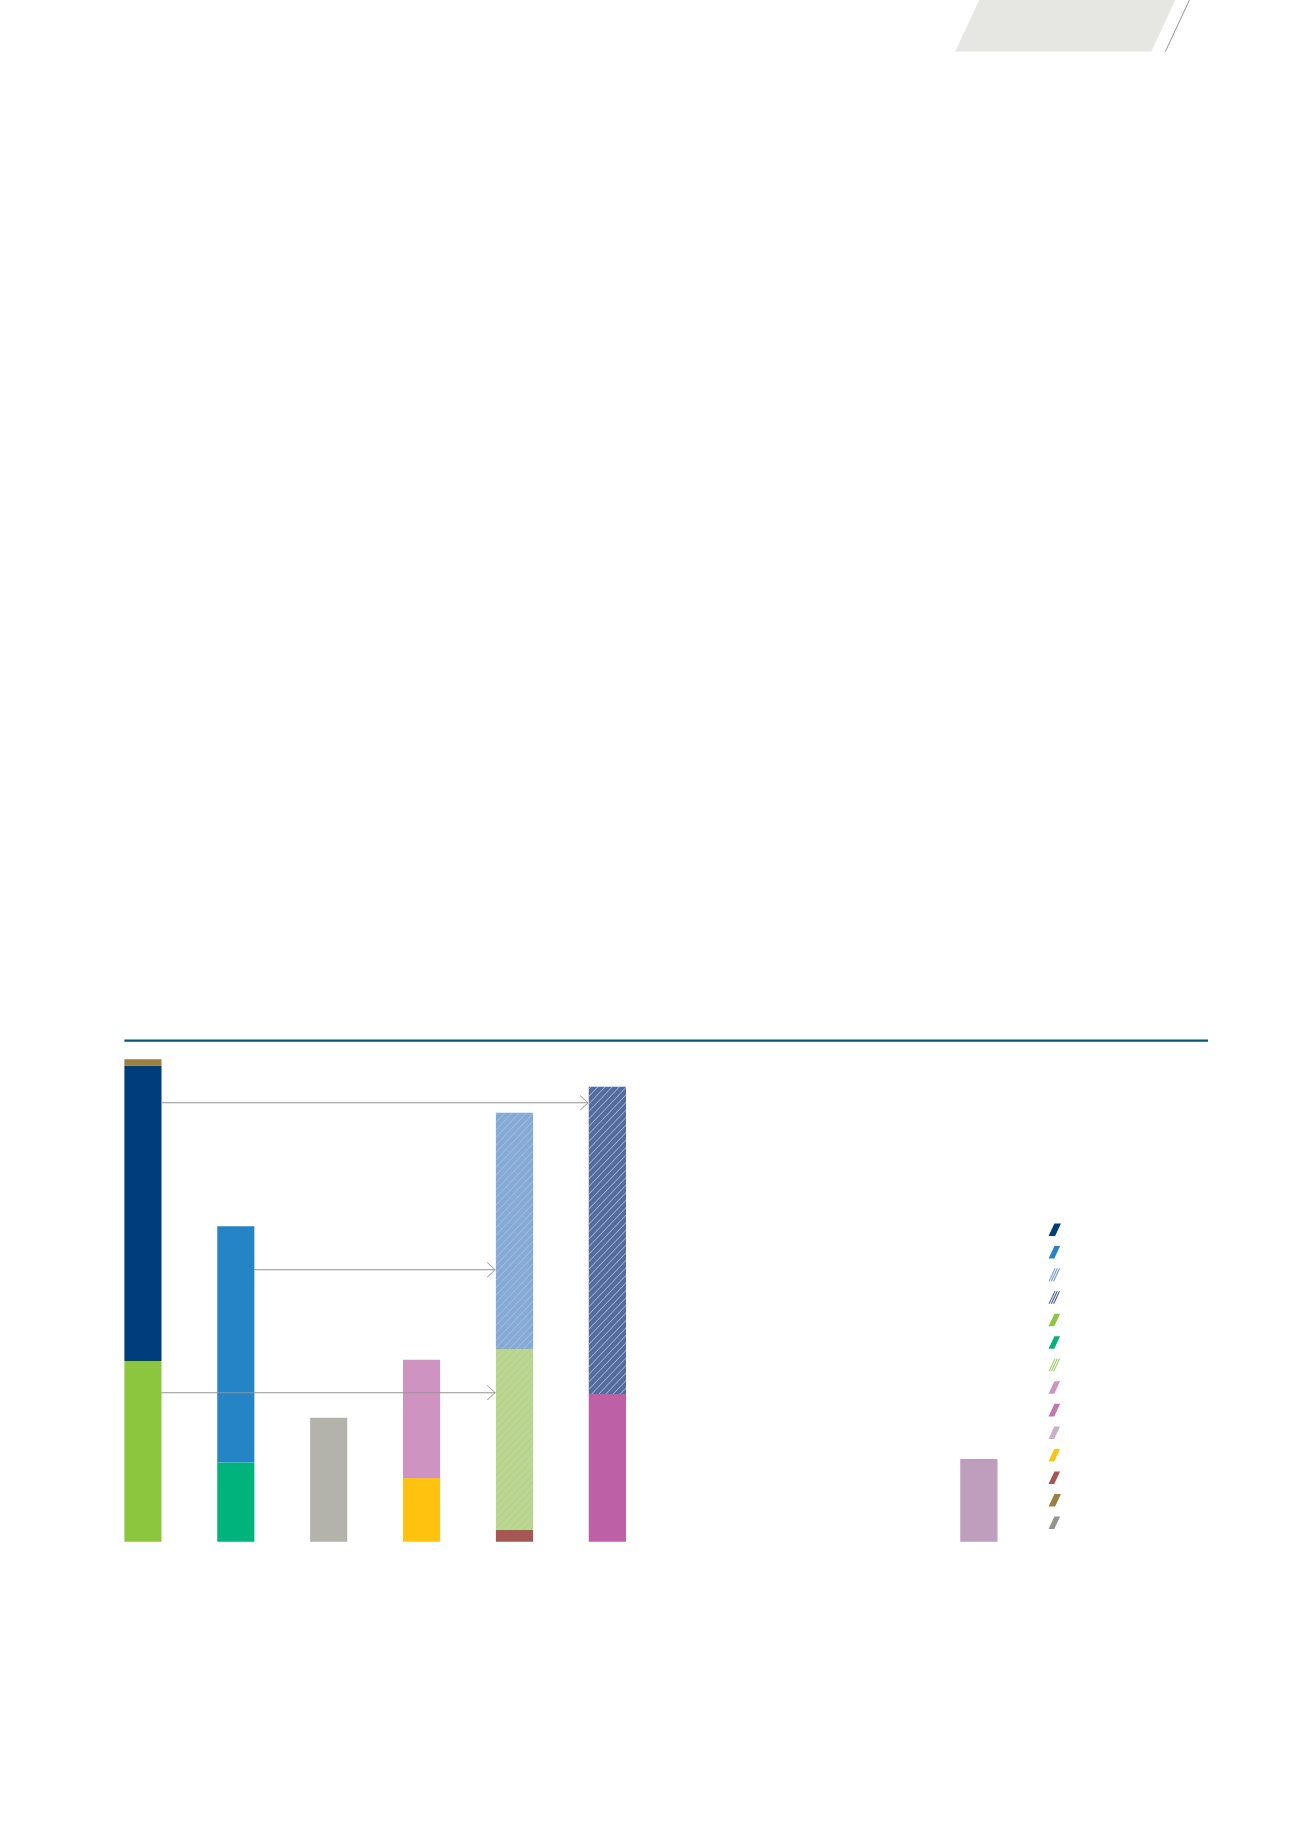
DEBT MATURITY PROFILE
AS AT 30 JUN 2017 (S$ MILLION)
FY 2017/18
FY 2018/19
FY 2019/20
FY 2020/21
FY 2021/22
FY 2022/23
FY 2023/24
FY 2024/25
FY 2025/26
FY 2026/27
Notes:
(1)
In June 2017, the Group has secured the refinancing of its A$145 million loan with the same bank ahead of its maturity in May 2018. The utilisation is expected to take place in
November 2017, which will extend the maturity to November 2021.
(2)
In July 2017, the Group has secured the refinancing of its S$250 million and S$200 million loans ahead of their respective maturities in June 2018 and September 2018.
The utilisation of the new facilities with a club of seven banks, comprising four and five year tranches, are expected to take place in September 2017.
(3)
In July and August 2017, the Group has prepaid JPY350 million term loan and JPY55 million Series 3 Japan bond respectively using the net proceeds from the divestment of
Harajuku Secondo in May 2017.
(4)
The Group has fully repaid the outstanding short-term RCF of S$3 million in July 2017.
153
153
(1)
54
(3)
250
3
(4)
260
(2)
200
(2)
200
67
70
105
100
125
10
(3)
S$250m term loan
S$200m term loan
S$200m term loan (new)
S$260m term loan (new)
A$145m loan
A$63m loan
A$145m loan (new)
S$100m MTN
S$125m MTN
S$70m MTN
JPY4.4b term loan
JPY0.8b bond
S$3m RCF
RM330m MTN
PERFORMANCE
57