S$ million
%
1
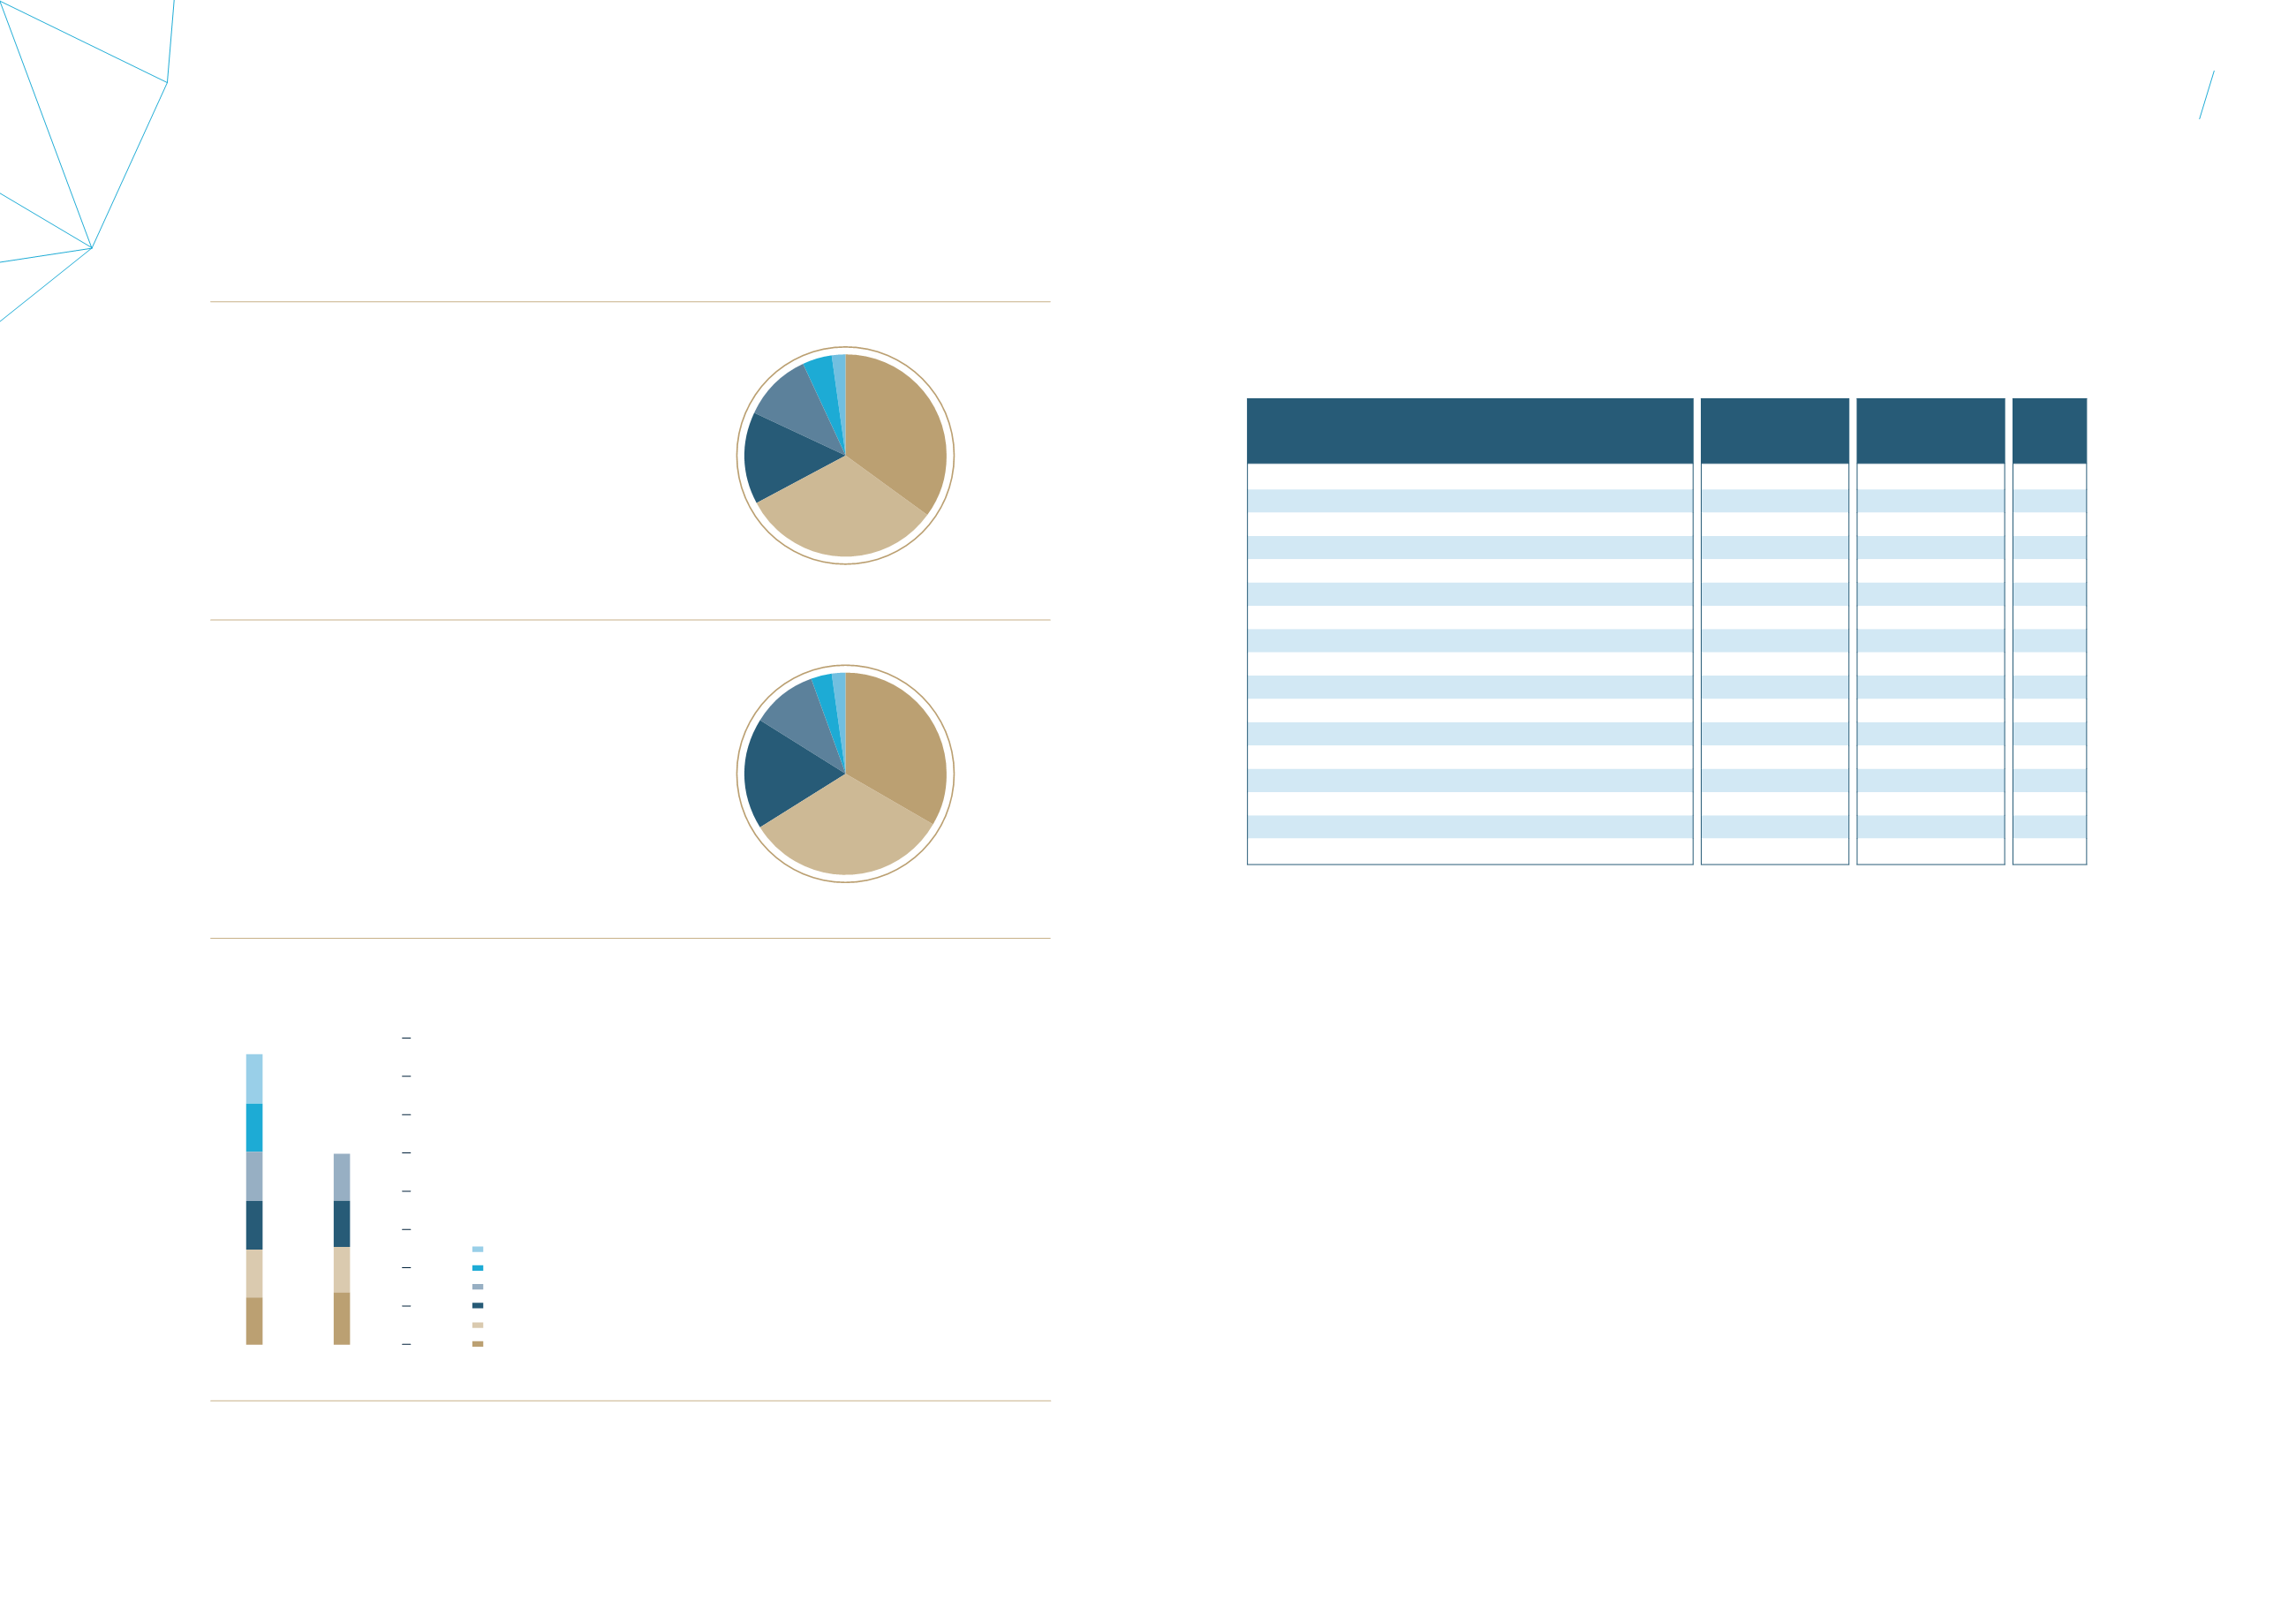
Wisma Atria Property
79.7 33.6
2 Ngee Ann City Property
77.8 32.7
3 Malaysia Properties
42.2 17.8
4 Australia Properties
(1)
25.1 10.6
5 Renhe Spring Zongbei Property
7.5
3.1
6 Japan Properties
5.3
2.2
NET PROPERTY INCOME
FY 2014/15 (18 months)
1
3
5 6
4
2
Financial
Review
FINANCIAL REVIEW – JULY 2014 TO JUNE 2015 (12 MONTHS) VERSUS JULY 2013 TO JUNE 2014 (12 MONTHS)
For the purposes of providing a 12-month yoy analysis of Starhill Global REIT’s financial performance, the figures for the
12-month period from 1 July 2014 to 30 June 2015 (“current 12-month period”) and the corresponding 12-month period from
1 July 2013 to 30 June 2014 (“corresponding 12-month period”) are presented below:
Group
July 2014 –
June 2015
(S$’000)
July 2013 -
June 2014
(S$’000)
Change
(%)
Gross revenue
197,152
195,491
0.8%
Property expenses
(37,785)
(40,384)
(6.4%)
Net property income
159,367
155,107
2.7%
Non property expenses
(48,984)
(46,935)
4.4%
Net income before tax
110,383
108,172
2.0%
Change in fair value of derivative instruments
2,145
(4,152)
NM
Change in fair value of investment properties
9,120
137,528
(93.4%)
Total return for the period before tax and distribution
121,648
241,548
(49.6%)
Income tax
2,077
(2,239)
NM
Total return for the period after tax, before distribution
123,725
239,309
(48.3%)
Non-tax (chargeable)/deductible items
(8,265)
(128,881)
(93.6%)
Income available for distribution
115,460
110,428
4.6%
Income to be distributed to:
- Unitholders
110,392
106,154
4.0%
- CPU holder(s)
770
1,042
(26.1%)
Total income to be distributed
111,162
107,196
3.7%
Distribution per Unit
5.11 cents
4.93 cents
3.7%
Gross revenue for the current 12-month period was
S$197.2 million, an increase of S$1.7 million or 0.8% over
the corresponding 12-month period, mainly due to stronger
performance of Singapore Properties and higher contribution
from Australia Properties following the acquisition of Myer
Centre Adelaide in May 2015. The increase was partially offset
by lower contribution from Renhe Spring Zongbei Property
and weaker foreign currencies. NPI grew by S$4.3 million
or 2.7% over the corresponding 12-month period to reach
S$159.4 million for the current 12-month period, mainly in line
with the higher gross revenue and lower property expenses
of the Group.
Singapore Properties contributed 67.4% of total revenue or
S$132.9 million for the current 12-month period, 2.4% higher
than the corresponding 12-month period. NPI increased
by 3.9% to S$106.0 million, primarily due to positive rent
reversions and lower operating expenses.
Malaysia Properties contributed 14.7% of total revenue or
S$29.0 million in the current 12-month period, 2.2% lower
than the corresponding 12-month period. NPI for the current
12-month period of S$28.2 million was a 0.9% drop from
the corresponding 12-month period, mainly due to the
depreciation of RM.
Australia Properties contributed 11.5% of total revenue or
S$22.6 million in the current 12-month period, 17.5% higher
than the corresponding 12-month period. NPI for the current
12-month period was S$17.6 million, 17.6% higher than the
corresponding 12-month period, mainly due to contribution
from newly acquired Myer Centre Adelaide from May 2015
and positive rent reversion on the leases for David Jones
Building (including the rent review for David Jones lease
from August 2014). The increase was partially offset by
depreciation of A$.
Renhe Spring Zongbei Property in Chengdu, China,
contributed 4.3% of total revenue or S$8.5 million in the
current 12-month period, 26.9% lower than the corresponding
12-month period. NPI for the current 12-month period was
S$4.3 million, 34.8% lower than the corresponding 12-month
period, largely due to lower revenue amidst contraction of
the high-end and luxury retail segment resulting from the
government austerity drive and increased competition from
new and upcoming retail developments in the city.
Japan Properties contributed 2.1% of total revenue or
S$4.2 million in the current 12-month period, 20.1% lower
than the corresponding 12-month period. NPI for the current
12-month period was S$3.3 million, 7.1% higher than the
S$ million
%
1
Wisma Atria Property
103.5 35.1
2 Ngee Ann City Property
94.8 32.2
3 Malaysia Properties
43.8 14.8
4 Australia Properties
(1)
32.4 11.0
5 Renhe Spring Zongbei Property
13.8
4.7
6 Japan Properties
6.6
2.2
1
5 6
4
3
2
GROSS REVENUE
FY 2014/15 (18 months)
5.00
(2) (3)
FY 2014/15 FY 2013
8.0
7.0
6.0
5.0
4.0
3.0
2.0
1.0
0.0
FY 2014/15
FY 2013
6Q
1.29
(1)
NA
5Q
1.26
NA
4Q
1.29
1.23
3Q
1.27
1.21
2Q
1.25
1.19
1Q
1.24
1.37
(2)
7.60
(1) (3)
Notes:
(1)
Included contribution from the newly acquired
Myer Centre Adelaide from May 2015.
(2)
Included one-time DPU payout of 0.19 cents due
to receipt of accumulated rental arrears from
Toshin master lease (net of expenses).
(3)
The computation of DPU for FY 2014/15 is based
on the number of units entitled to distributions
comprising 2,153,218,267 units in issue for
1Q to 5Q FY 2014/15 and the number of units
post-CPU conversion on 25 June 2015 of
2,181,204,435 units for 6Q FY 2014/15. The
computation of DPU for FY 2013 is based on
the number of units entitled to distributions
comprising 1,943,023,078 units in issue for
1Q FY 2013 and the number of units post-CPU
conversion on 5 July 2013 of 2,153,218,267 units
for 2Q to 4Q FY 2013.
DISTRIBUTION PER UNIT
(cents)
61
60
STARHILL
GLOBAL
REIT
Annual
Report
FY 2014/15


