corresponding 12-month period, mainly due to reversal of
rental arrears provision in the current 12-month period.
The increase was partially offset by depreciation of JPY and
loss of income contribution following the divestment of
Holon L in March 2014.
Non property expenses for the current 12-month period
were S$49.0 million, a S$2.0 million or 4.4% increase over
the corresponding 12-month period. This was mainly due to
higher finance expenses and management fees in the
current 12-month period.
Finance expenses for the current 12-month period were
S$31.7 million, a S$1.5 million or 4.9% increase over the
corresponding 12-month period. This was mainly due to
additional interest costs incurred for the A$145 million
loan and the S$125 million MTN drawn/issued in May 2015,
full period of interest cost from the S$100 million MTN
issued in February 2014, as well as amortisation of the
remaining capitalised borrowing costs for the early
refinancing of JPY6.3 billion and S$100 million term loans,
and RM330 million MTN. The increase was partially offset
by lower interest costs incurred on the existing foreign
currency borrowings.
Management fees for the current 12-month period were
S$15.0 million, a S$0.5 million or 3.6% increase over the
corresponding 12-month period. The increase was in line
with the higher average value of trust property during the
current 12-month period.
Trust expenses for the current 12-month period were
S$3.0 million, a S$0.1 million or 2.0% drop from the
corresponding 12-month period. The S$0.4 million gain on
divestment in the corresponding 12-month period represented
the difference between the net proceeds and the carrying
amount of Holon L divested in March 2014.
Income tax credit for the current 12-month period was
S$2.1 million as compared to income tax expenses of
S$2.2 million in the corresponding 12-month period. This was
mainly attributed to the deferred tax reversal arising from
downward property revaluation of Renhe Spring Zongbei
Property, lower net income of Renhe Spring Zongbei Property
for the current 12-month period, as well as lower withholding
tax provision for Renhe Spring Zongbei Property and the
Japan Properties. The variance was partially offset by higher
withholding tax provision for the Australia Properties.
The change in fair value of derivative instruments of
S$2.1 million for the current 12-month period represented
mainly fair value gain on interest rate swaps and caps for the
Group’s borrowings. The change in fair value on investment
properties of S$9.1 million for the current 12-month period
represented the net revaluation gain on the Group’s
investment properties.
Financial
Review
Income available for distribution for the current 12-month
period was S$115.5 million, an increase of S$5.0 million or
4.6% over the corresponding 12-month period. Income to
be distributed to the Unitholders and holder of CPU for the
current 12-month period was S$111.2 million, an increase of
S$4.0 million or 3.7% over the corresponding 12-month period.
Total DPU for the current 12-month period from 1 July 2014
to 30 June 2015 was 5.11 cents, representing an increase of
3.7% over DPU of 4.93 cents achieved for the corresponding
12-month period from 1 July 2013 to 30 June 2014.
ASSETS AND LIABILITIES
The Group’s total assets as at 30 June 2015 were
S$3,193.4 million, representing an increase of S$250.2 million
or 8.5% compared to S$2,943.2 million as at 31 December
2013, mainly due to the newly acquired Myer Centre Adelaide
in May 2015. The Group’s portfolio of 13 prime properties
across five countries was independently revalued at
approximately S$3,116.2 million as at 30 June 2015, recording
a net revaluation gain of S$9.1 million for FY 2014/15. The
geographic breakdown of the portfolio by asset value as
at 30 June 2015 was as follows: Singapore 66.5%, Australia
16.1%, Malaysia 12.7%, Japan 2.6% and China 2.1%.
The Group’s total liabilities as at 30 June 2015 were
S$1,210.6 million, representing an increase of S$277.6 million
or 29.8%, compared to S$933.0 million as at 31 December
2013, mainly in line with the additional borrowings drawn
to fund the Myer Centre Adelaide acquisition. Gearing
increased from 29.0% as at 31 December 2013 to 35.5%
as at 30 June 2015.
The Group’s net asset value remained largely stable at
S$1,982.8 million (NAV per Unit of S$0.91) as at 30 June 2015,
compared to S$2,010.1 million (NAV per Unit of S$0.93) as
at 31 December 2013.
CASH FLOW
Total net cash outflow (excluding effects of exchange
rate differences) for FY 2014/15 was S$3.7 million, largely
comprising cash outflow from investing activities of
S$315.8 million, partially offset by net cash flows from
operating activities of S$212.4 million and cash inflow from
financing activities of S$99.8 million. The cash outflow
from investing activities related mainly to the purchase of
Myer Centre Adelaide in May 2015. Cash flows from financing
activities comprised mainly proceeds from borrowings,
partially offset by repayment of borrowings and distributions
paid to Unitholders.
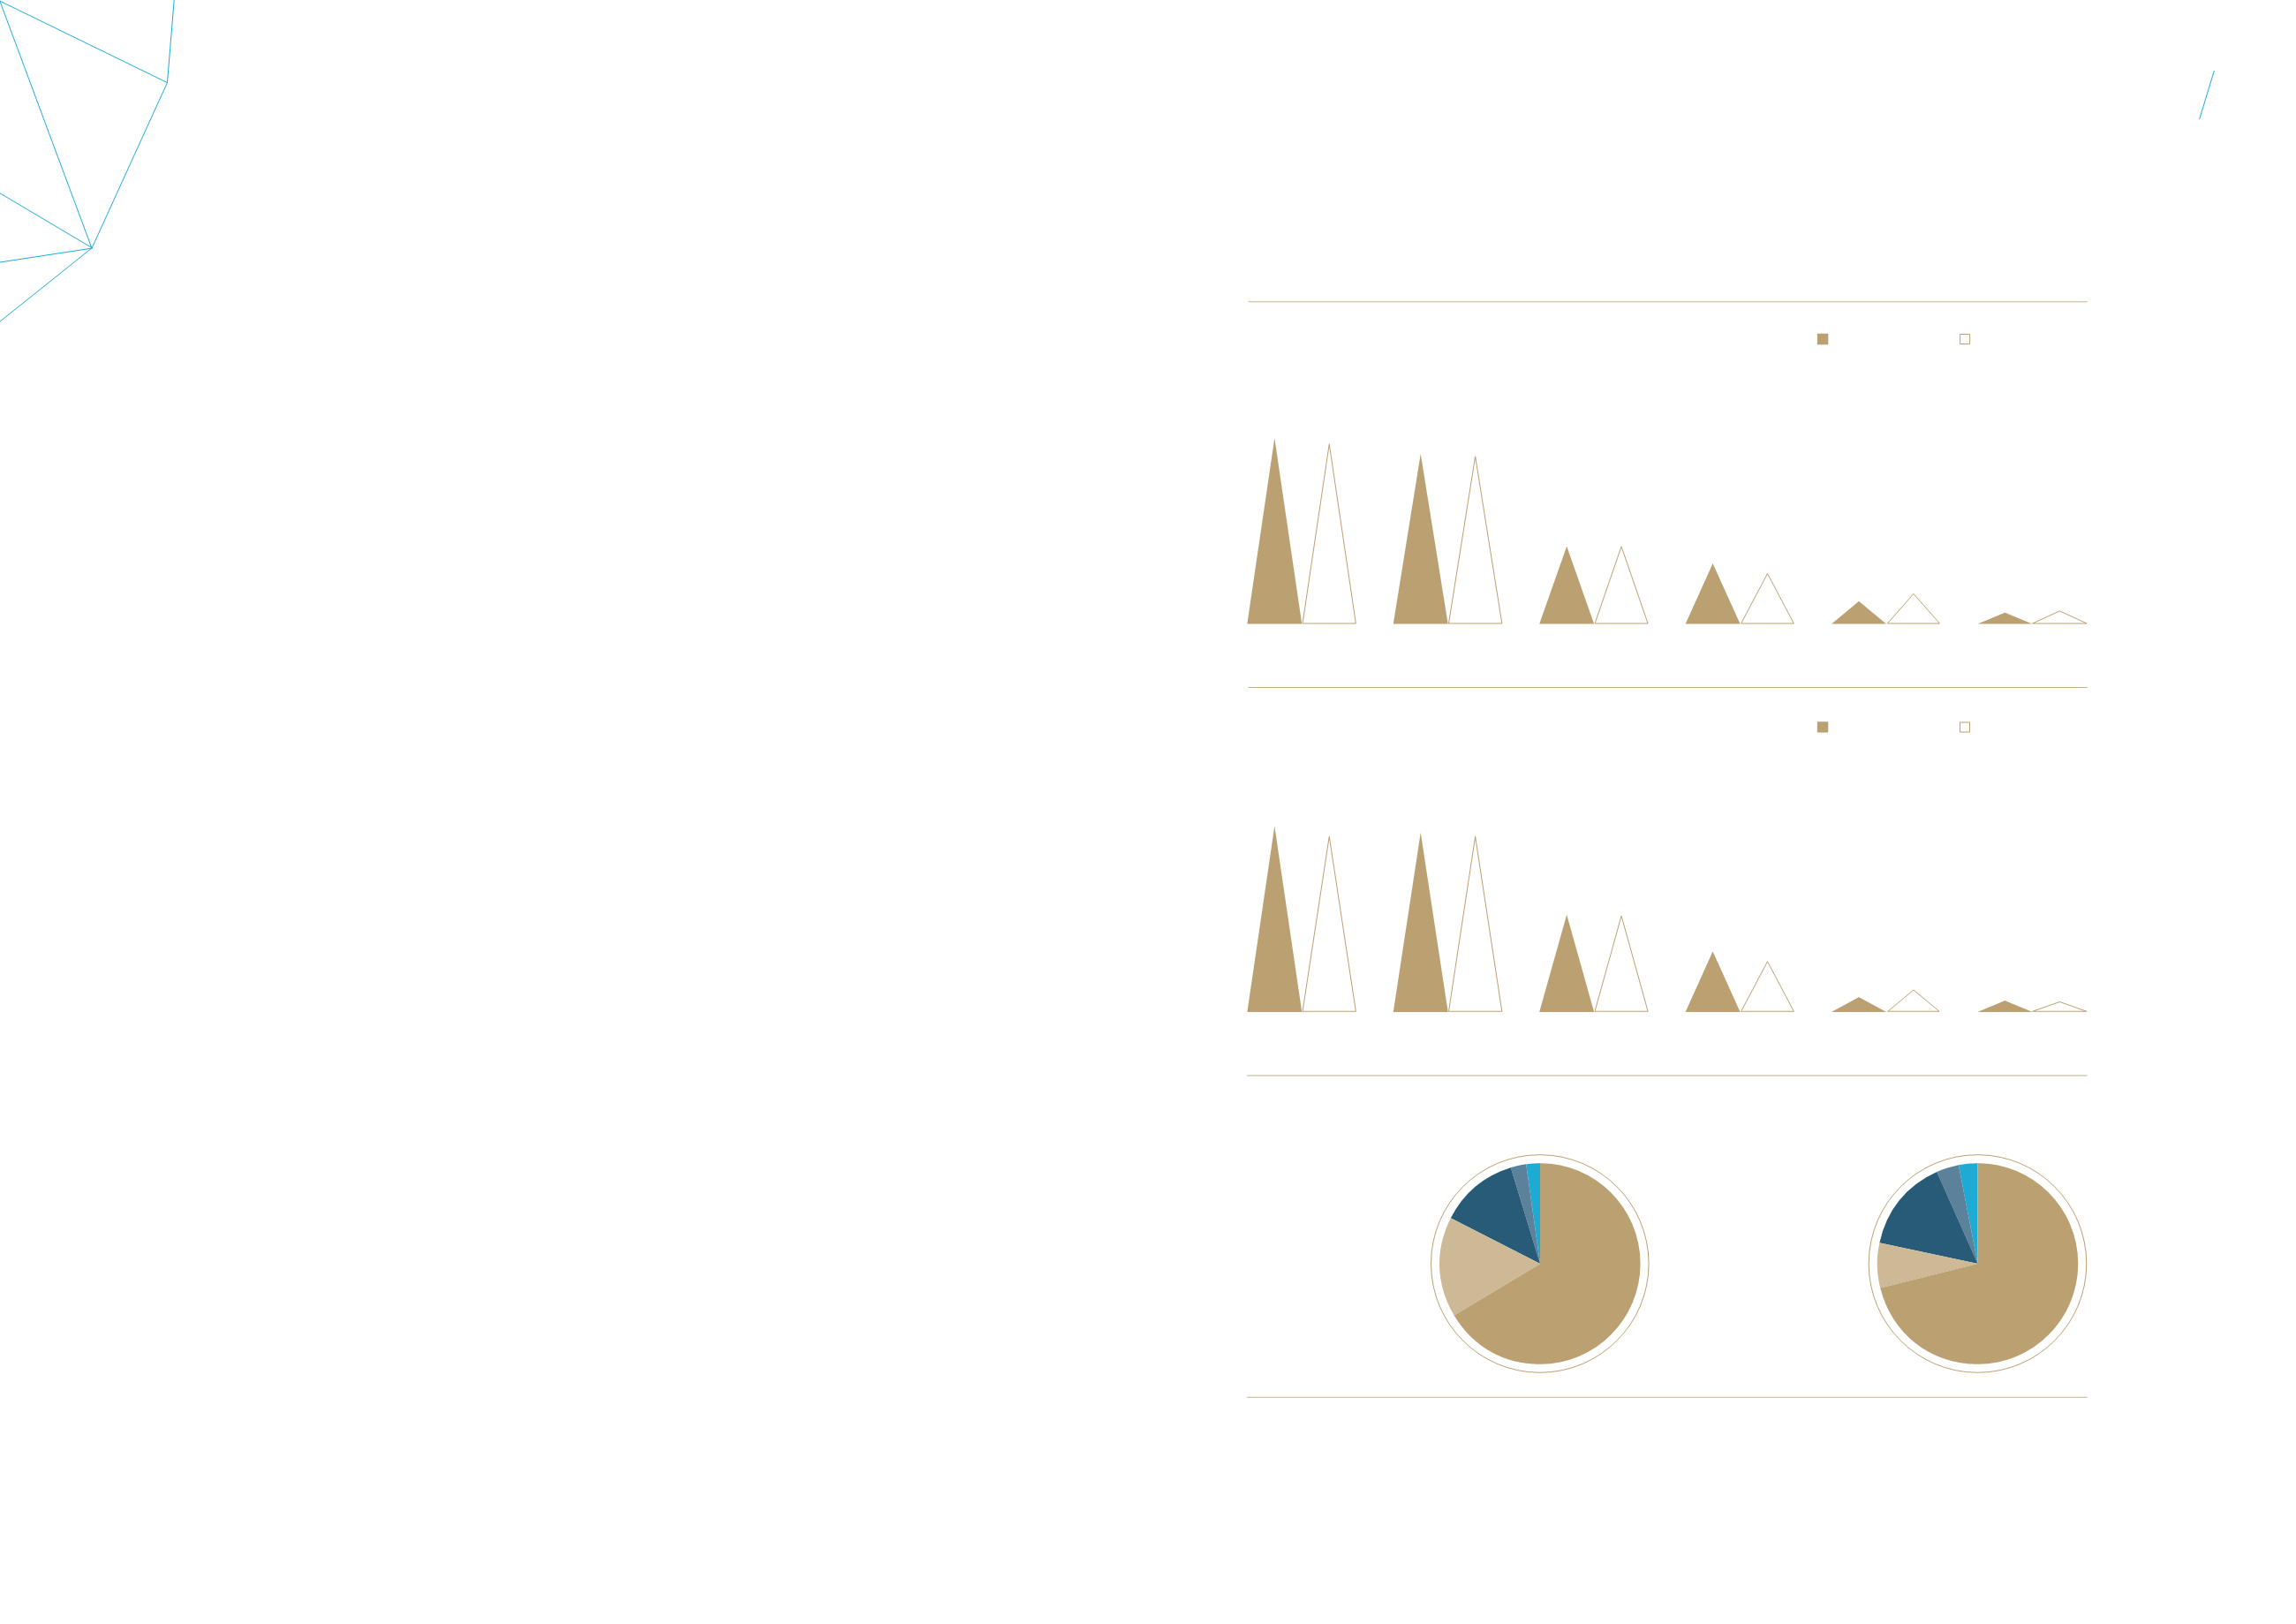
GROSS REVENUE
(S$ million)
% contributed by:
12 months from
Jul 14 – Jun 15
12 months from
Jul 13 – Jun 14
Wisma Atria Property
35.2%
34.4%
Ngee Ann City Property
32.2%
32.0%
Malaysia Properties
14.7%
15.2%
Australia Properties
11.5%
9.8%
Renhe Spring Zongbei Property
4.3%
5.9%
Japan Properties
2.1%
2.7%
69.4
67.2
63.5
62.6
29.0
29.6
22.6
19.3
8.5
11.6
4.2
5.2
Wisma Atria
Property
Ngee Ann City
Property
Malaysia
Properties
Renhe Spring
Zongbei Property
Australia
Properties
Japan
Properties
ASSET VALUE BY COUNTRY
As at 30 Jun 2015
1 Singapore
66.5%
2 Australia
16.1%
3 Malaysia
12.7%
4 Japan
2.6%
5 China
2.1%
1
54
3
2
As at 31 Dec 2013
1 Singapore
71.3%
2 Australia
7.3%
3 Malaysia
15.0%
4 Japan
3.5%
5 China
2.9%
1
54
3
2
NET PROPERTY INCOME
(S$ million)
% contributed by:
12 months from
Jul 14 – Jun 15
12 months from
Jul 13 – Jun 14
Wisma Atria Property
33.8%
32.8%
Ngee Ann City Property
32.7%
33.0%
Malaysia Properties
17.7%
18.3%
Australia Properties
11.0%
9.6%
Renhe Spring Zongbei Property
2.7%
4.3%
Japan Properties
2.1%
2.0%
53.9
50.9
52.1
51.1
28.2
28.5
17.6
14.9
4.3
6.6
3.3
3.1
Wisma Atria
Property
Ngee Ann City
Property
Malaysia
Properties
Renhe Spring
Zongbei Property
Australia
Properties
Japan
Properties
63
62
STARHILL
GLOBAL
REIT
Annual
Report
FY 2014/15


